Clean, professional figures can elevate your grant proposal or paper to the next level. But making figures for a paper or grant proposal is not easy – especially since scientists often don’t know how to use illustration software.

Hence, when you set out to start making a figure for your paper, a mountain of questions presents itself: Which graphic design software should I use for scientific illustrations? What is the difference between pixel-based and vector-based images? Which resolution does a figure for a paper need to have? Do I have to use RGB or CMYK color space for figures in a grant proposal? And, finally, can I use PowerPoint to make figures for a paper or grant proposal?
The answer to that last question is a big NO, by the way. Read why, and learn the answers to all the other questions below.
Or simply contact me and I’ll make your figure for you!
Which software do I need to use when making figures for a paper or grant proposal?
There are two general types of graphic design programs: pixel-based and vector-based.
First, let’s look at pixel-based software. The type of illustration you do with them are often called “digital paintings” or “digital art”. Usually, they offer a large variety of “brushes” that imitate different real-life media. By that I mean pencils, markers and pens, but also oil paint, pastels, charcoal and everything else you can imagine. Examples of such programs are Adobe Photoshop (expensive), Corel Painter (reasonably priced) and Krita (free!), among many others.
Now, scientific illustrations are not art. They need to convey a clear message with no room for interpretation. Hence, a program primarily made to create art is not quite the right choice when making figures for a paper or grant proposal.
You can’t easily edit pixel-based illustrations
If you’re not yet convinced that Photoshop and its cousins are not the right tool, here is another argument: In those programs, you pick a brush and make a mark. Now, if you’re unhappy with what you’ve made, you need to erase it and start again. Moreover, if you make your entire painting on the same digital canvas, you cannot easily change just one part of it.
That’s because of the way pixel-based painting programs work: When you choose a brush and start painting, the program colours the pixels you touch with the brush. If you paint over the same pixel with a different colour, it changes. But all neighbouring pixels are independent of each other! They don’t “know” that its neighbour, who has the same colour, belongs to the same shape. This means that you cannot easily edit a shape after you’ve painted it in a pixel-based graphics program.
Another drawback of pixel-based programs is that you cannot change the resolution of your painting after the fact. You can make it larger, but then the resolution will become smaller. All in all, digital painting software is not suited for making scientific illustrations!
Vector illustration programs are best for making figures for a paper or grant proposal
Vector-based illustration software works with lines and geometric shapes. The program defines the length, curvature, and angle of lines and outlines with the help of mathematical formulas. Each line and shape has at least two nodes (other terms for the same thing are “vertices” or “anchor points”). You can move the nodes to change the shape. The nodes can also have handles with which you can change the curvature of the line that this node controls.
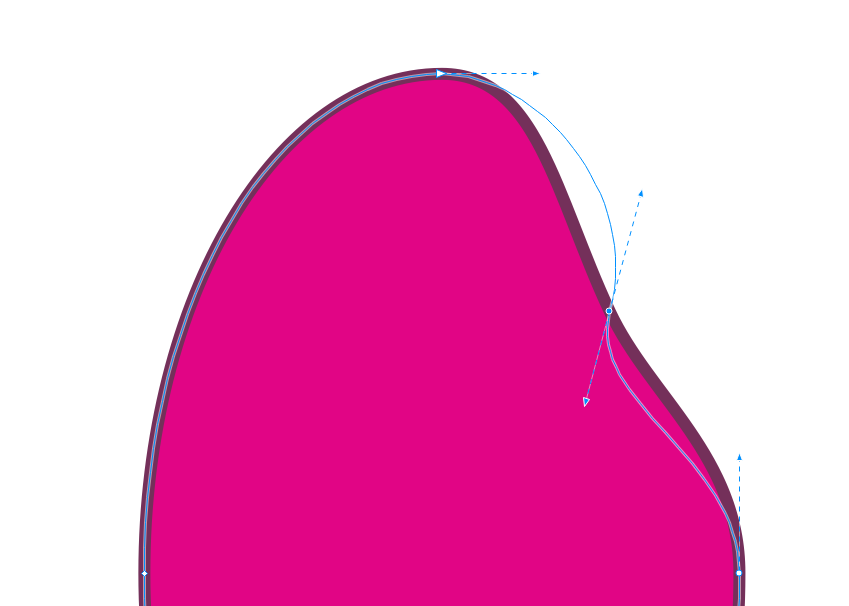
There are a myriad of options to style the outline or shape of a vector object. For example, you can choose the colour for the fill and outline of the shape – and change it as often as you need to. You can also make the outline dashed in any way you want. Furthermore, you can use colour gradients or even patterns to fill a shape.
But the best part is that the shape is one single object that “knows” which outline and colour belongs to it. Hence, you can can move around and change the shape in any way you want, indefinitely. Also, all shapes are independent of each other, so you can edit where they are in relation to each other.
Examples for vector illustration programs are Adobe Illustrator (expensive), CorelDRAW (reasonable priced) and Inkscape (free!)
Don’t use PowerPoint (or Keynote, or any other presentation software)
I understand the temptation. You use presentation software all the time and they have all these shapes and lines that you can assign colours to… So, why should you not use them?
There are three reasons why presentation software is not suited to make scientific illustrations. Firstly, Resolution. These programs are made for screens. Therefore, the slides you make have a resolution of 96 dpi. However, for printing, we need a resolution of 300 dpi – more than three times as much! There are ways to tell PowerPoint to export slides to JPG at 300 dpi. So, in theory, this problem has a solution. The other two, however, don’t.
PowerPoint uses RGB colours
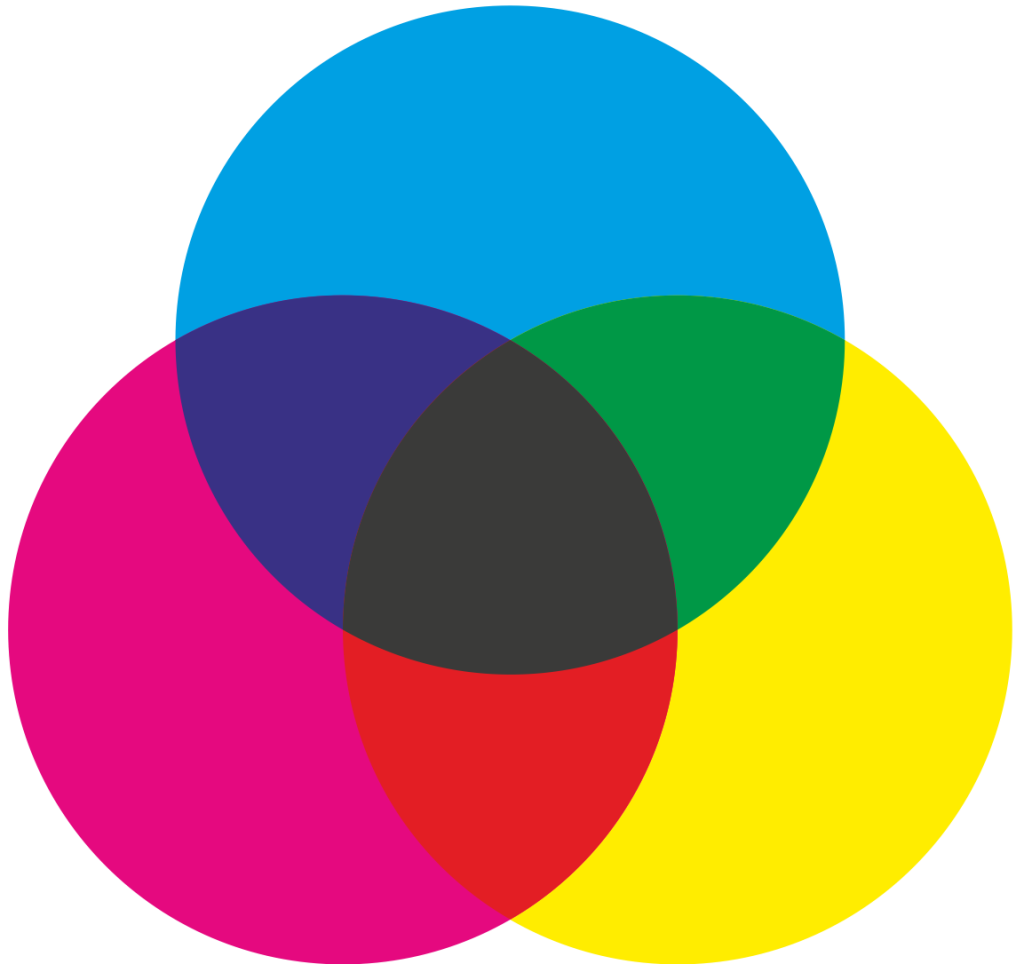
The second reason to not use PowerPoint to make figures for a paper or grant proposal is the colour space. Since these programs are made for screens, they use the colour space RGB. For printing, we need the CMYK colour space though. CMYK cannot reproduce many of the brilliant colours of the RGB colour space! Look at this example:
Your illustrations can therefore look very different after printing! And while you can transform an RGB image to CMYK and vice versa, this is only possible after you’ve made and exported the figure in PowerPoint. Hence, it is better to work in a program that uses CMYK to begin with, so you’ll see what the figure will look like when printed.
Presentation software has too few tools to make good vector illustrations
They just don’t have the ease of use and flexibility you will need. Presentation software can make a few shapes and you can edit them, too. But have you tried grouping shapes and resizing them in PowerPoint? The program will resize each shape individually, thereby messing up the arrangement. It does not properly resize stroke thickness either, and editing single nodes is clunky and difficult. As if that wasn’t enough, PowerPoint and Co. lack a lot of the more sophisticated tools you will need for a clean scientific illustration.
Bottom line: Definitely use dedicated vector illustration software like CorelDRAW for scientific illustrations!
Do I have to use RGB or CMYK for figures in a grant proposal?
I already answered that question above – you usually need CMYK. But what makes RGB and CMYK so different?
Screens produce colour by basically shining light through a coloured filter, whereas printers place physical pigment on paper. You can imagine that colour produced by light allows for brighter, more brilliant shades than colours produced by pigments.
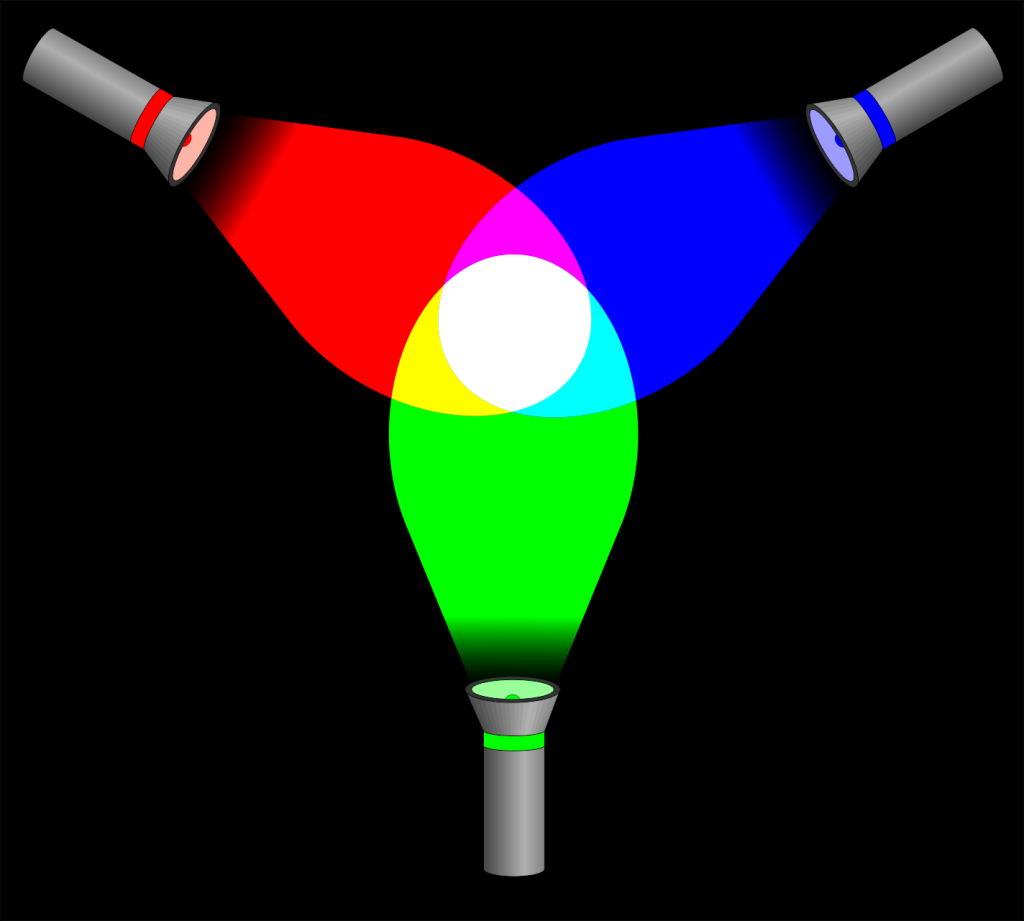
Also, screens use three colours, namely Red, Green, and Blue, while printing uses four: Cyan, Magenta, Yellow and Black. It’s only logical that you can’t mix the exact same shades with two different sets of base colours. And then there is the fact that RGB is an additive colour model and CMYK is a subtractive one. Read more about what that means on this page.
So, if you want to make a figure that someone will print, use CMYK. If, however, you make an illustration that will only ever be used in presentations, you can go for RGB.
Which resolution does a figure for a paper need to have?
This, too, has ben touched on above. You need to have a resolution of at least 300 dpi. But this only works if your figure is large enough!
First of all, “dpi” stands for “dots per inch”. Sometimes people also call it “ppi”, “pixels per inch”. It’s the same thing. Please be aware that this means a single line of 300 pixels that measures 2,54 cm in length. So, one square inch has 300 x 300 = 90,000 pixels.
However, having the proper resolution is not enough – your figure also needs to have the right size! Why? Let me start with an anecdote: You’ve probably seen a crime show on TV where they have some pixelated footage from a CCTV camera. The murderer’s car is in the footage, but oh no, the detectives can’t make out the number plate because it’s too pixelated! So, they go to their IT guy and go, “Zoom in… more… now make it sharper… Bingo!” The number plate is suddenly ultra sharp.
Making a pixel-based image larger reduces its resolution
That thing from the TV crime shows doesn’t exist in real life. One pixel is the smallest unit of the footage – and of any pixel-based image. There is no way to split one pixel into four pixels and magically retrieve the information that would have been stored in those four pixels if they had been there to begin with.
Hence, when you make a pixel-based image larger or zoom in, all you do is make the pixels bigger. When they get too large, you can see them with the naked eye, making the illustration look bad. So, it is important when making figures for a paper or grant proposal to make them at least as large as their printed version needs to be and 300 dpi. Read more about how to do that here.
The good news is: Since you are using vector illustration software, you can simply select your entire figure and scale it up. Because there are no pixels in vector illustrations, the quality will always be crisp and sharp, no matter how large you make your creation.
Only when you export your illustration to JPG does the figure get transformed into pixels. But if you make sure that your figure is large enough and that you select 300 dpi in the export dialogue, nothing can go wrong.
No time to learn vector illustration? Contact me to make your figure for you!